

Compile overall
Overview
On the homepage of Rsdoctor, there is a card called Compile Overall that provides information about the compilation process of the current project. The content is shown in the following image:
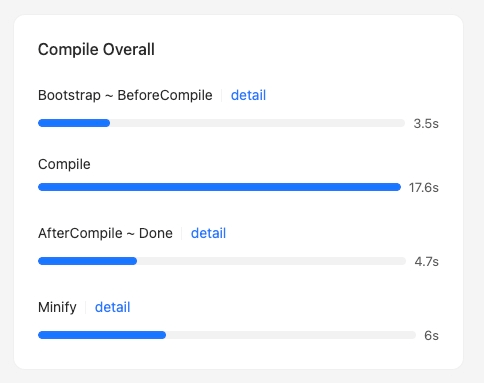
For each compilation phase, if the time data is displayed in blue, it means that you can click to view the detailed time breakdown.
Glossary
The following table explains the meaning and code implementation of each phase in the card:
Usage instructions
Bootstrap -> BeforeCompile details
By clicking on the data of the Bootstrap -> BeforeCompile phase, a popup will appear on the page, as shown in the following image:
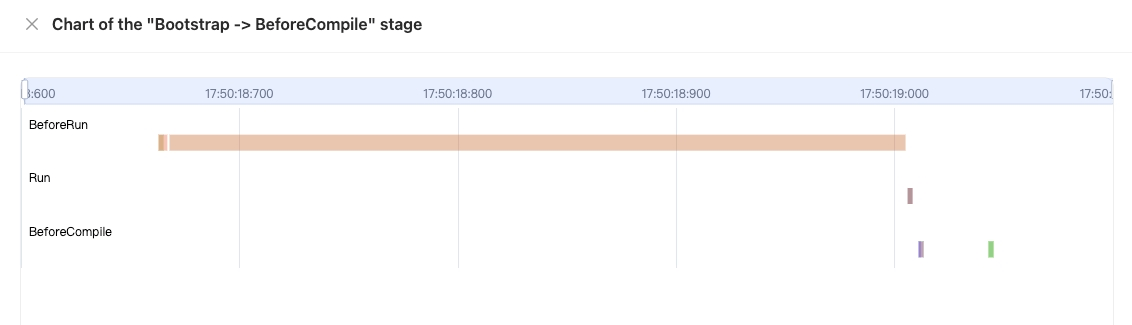
The popup mainly contains a chart:
- The x-axis represents time
- The y-axis represents all the hooks that have been tapped by plugins before the compiler.hooks.beforeCompile is called
- The data in the chart represents the start and end time of each hook.
Hovering over a data point in the chart will display the following information in a tooltip:
- hook: the name of the hook
- tap name: the name value when .tap is called
- start: the start time
- end: the end time
- duration: the duration, calculated as
end - start
Compile phase
In this section, you can navigate to "Compile Analysis" -> "Loader Analysis" -> "Loader Timeline" in the navigation bar to view the timeline of loader compilation time.
AfterCompile -> done details
By clicking on the data of the AfterCompile -> Done phase, a popup will appear on the page, as shown in the following image:
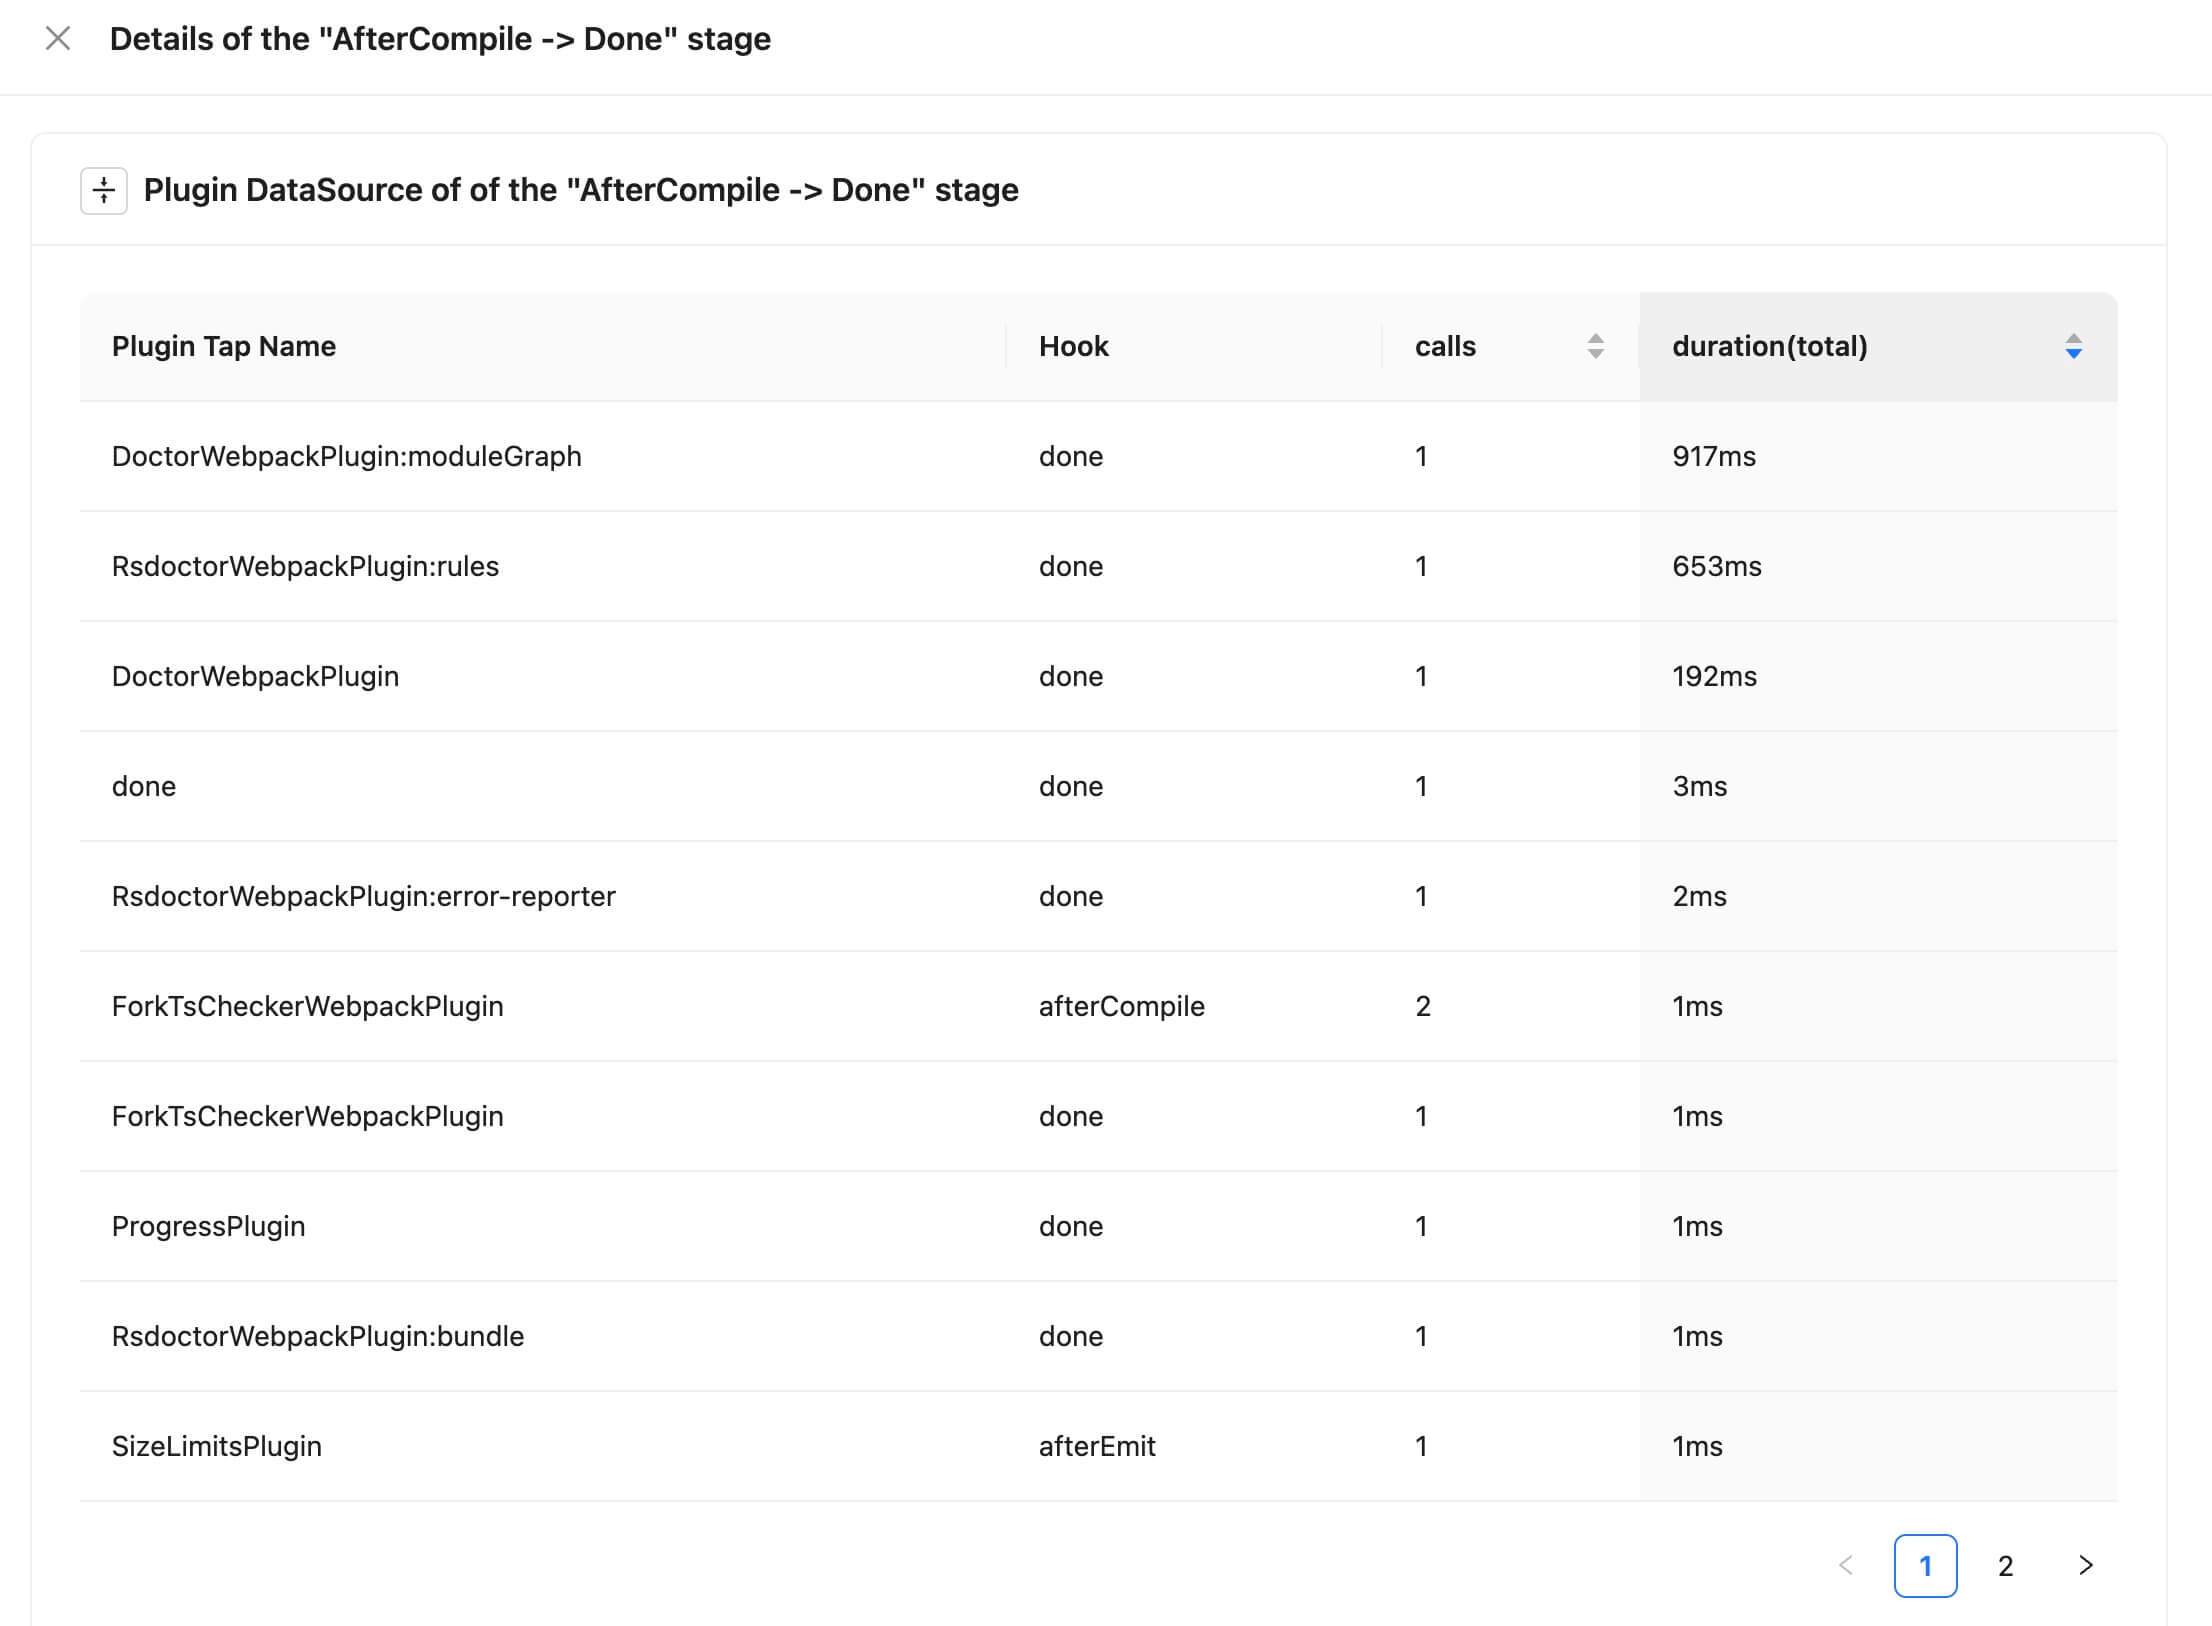
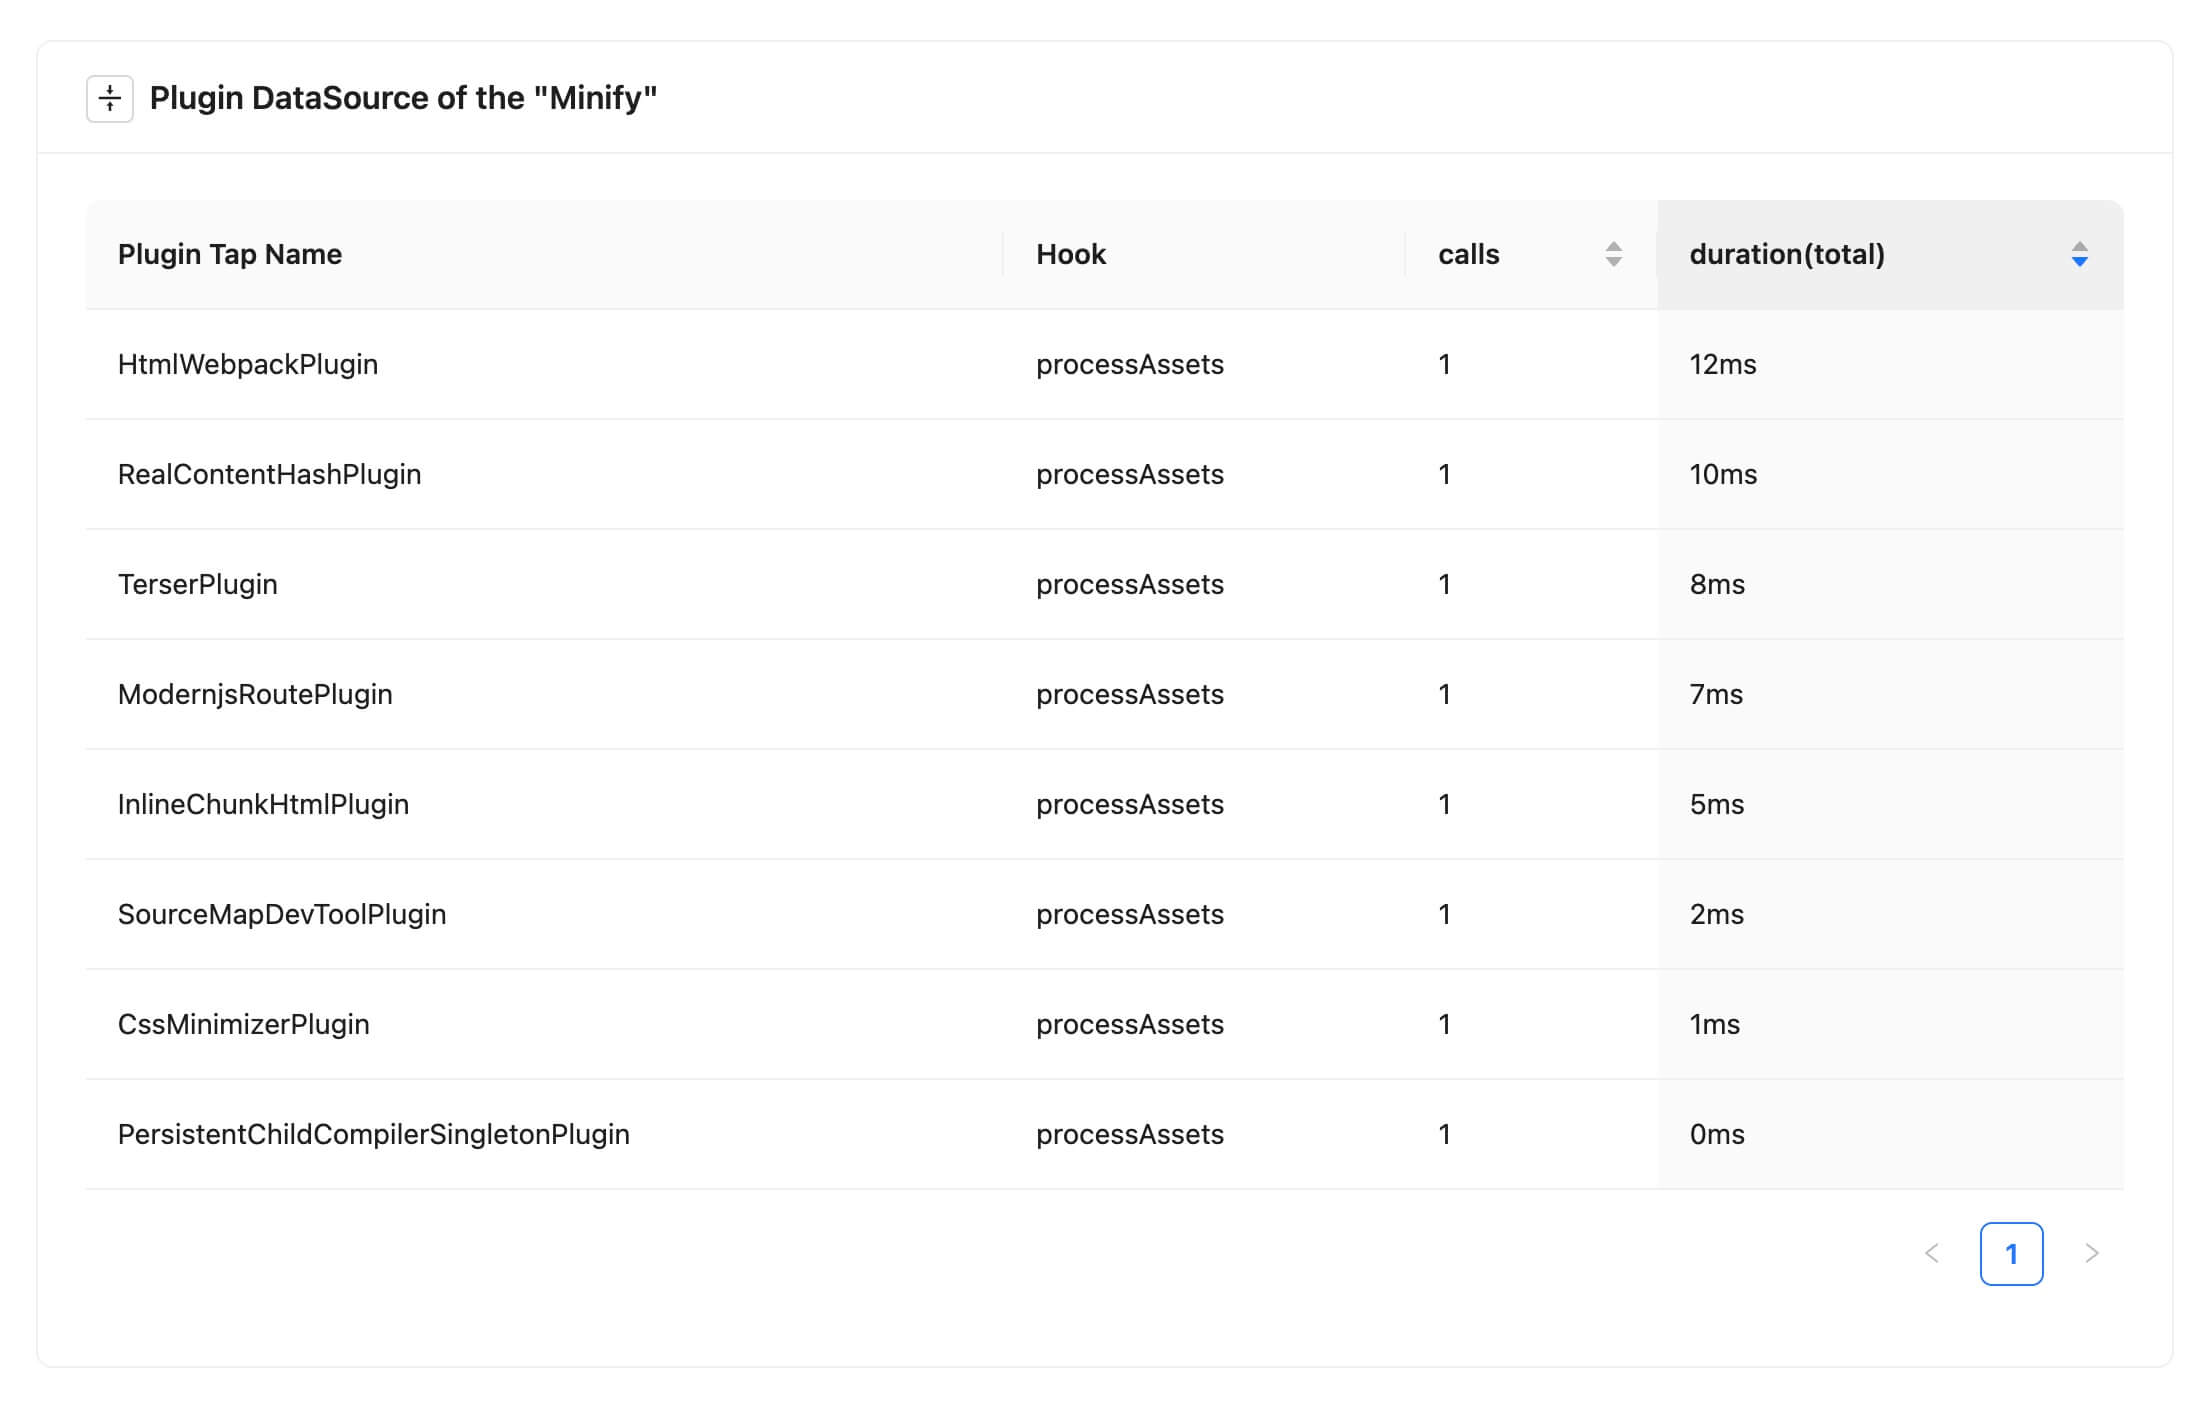
The popup mainly contains a data table that shows the relevant data of the calls. The field meanings are as follows:
- Plugin Tap Name: the name value when .tap is called
- Hook: the name of the hook
- calls: the number of times the hook is called
- duration(total): the total time of all the calls
Scrolling down the page will show the corresponding chart:
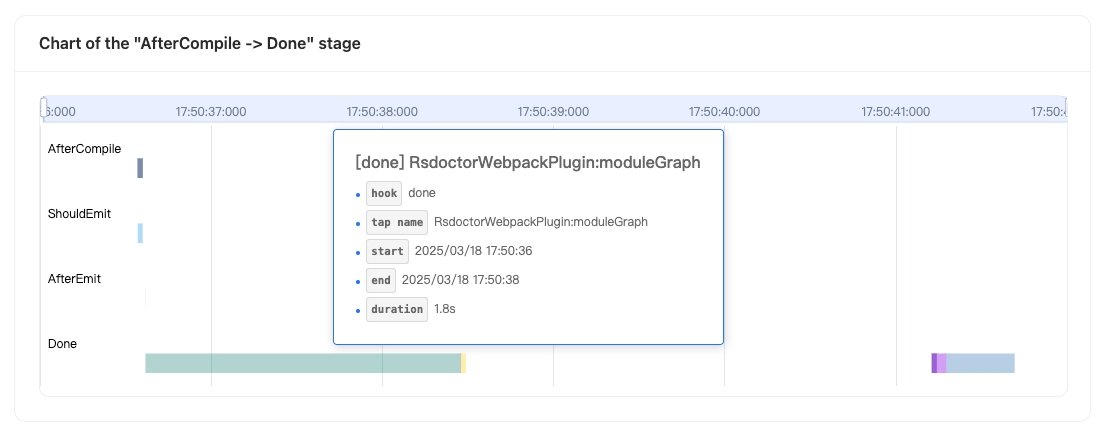
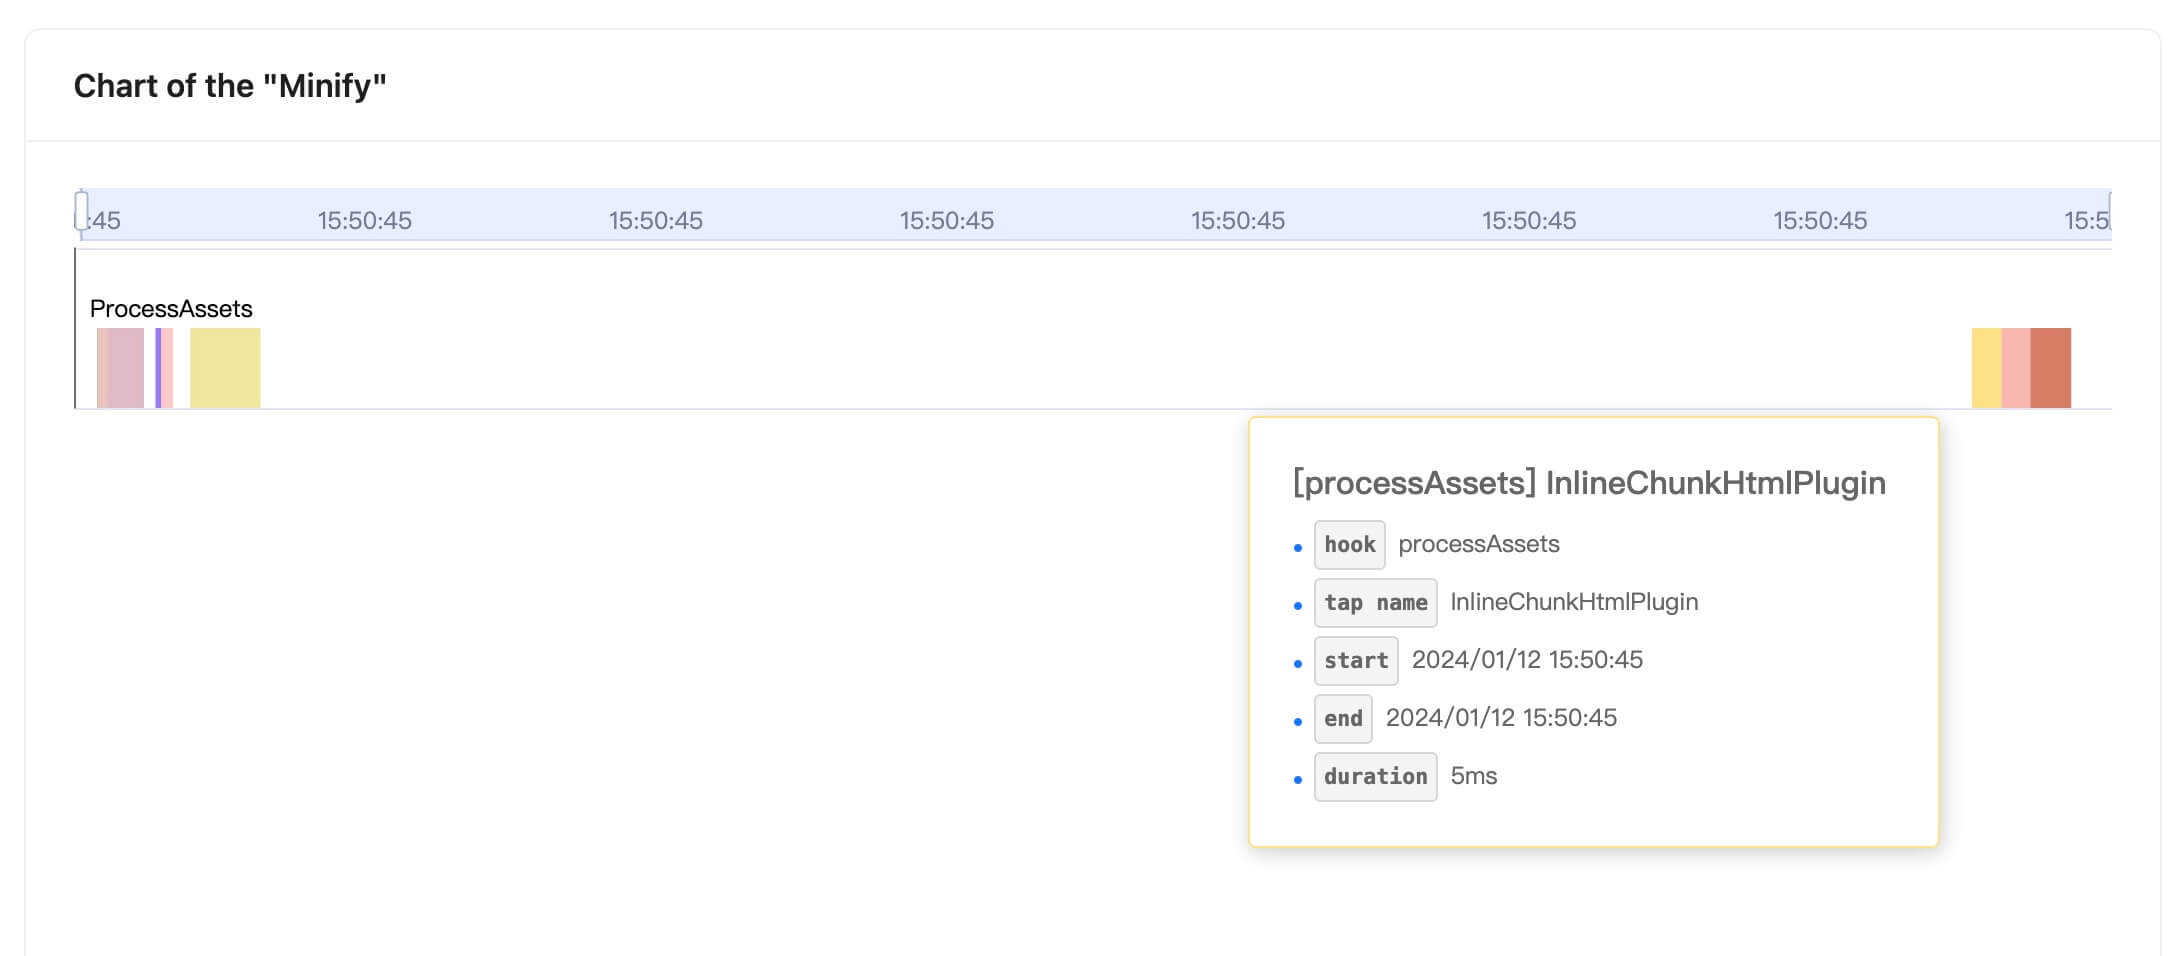
The chart shows:
- The x-axis represents time
- The y-axis represents all the hooks that have been tapped by plugins between compiler.hooks.afterCompile and compiler.hooks.done
- The data in the chart represents the start and end time of each hook.
Hovering over a data point in the chart will display the following information in a tooltip:
- hook: the name of the hook
- tap name: the name value when .tap is called
- start: the start time
- end: the end time
- duration: the duration, calculated as
end - start
Minify details
Minify details are currently not available for Rspack projects.
By clicking on the data of the Minify phase, a popup will appear on the page, as shown in the following images:
 |  |
|---|
The content in the popup has similar meanings to the previous paragraphs, so it will not be repeated here.